[blackcat] L3 Top and Bottom Divine JudgmentOVERVIEW
The "Top and Bottom Divine Judgment" indicator is designed to identify potential tops and bottoms in the market using a combination of EMAs, SMAs, and custom calculations based on high and low prices. It provides multiple lines and plots to help traders visualize different market conditions and potential turning points.
FEATURES
Customizable EMA and SMA periods for various calculations.
Identification of bullish and bearish trends using EMAs.
Detection of overbought and oversold conditions.
Multiple lines and histograms to indicate specific market conditions and potential reversals.
Visual alerts with colored lines and shapes.
HOW TO USE
Add the script to your TradingView chart.
Customize Settings:
Adjust the short_ema_period, long_ema_period, sma_period, high_period, low_period, and other period inputs in the "Inputs" section.
Bullish and Bearish EMAs:
bullish_ema (yellow) and bearish_ema (fuchsia) are plotted to assess the overall market trend.
When bullish_ema is above bearish_ema, it suggests an uptrend.
When bullish_ema is below bearish_ema, it suggests a downtrend.
High-Low Boundary Line:
A horizontal line at 50 (yellow) represents a midpoint in the normalized price range, helping to identify overbought or oversold conditions.
Danger and Caution, Sell Signal, etc.:
These lines indicate specific conditions where the market might be overextended or due for a reversal.
Histograms for CZS1 and CZS4:
These histograms (aqua and purple) represent changes in certain indicators, possibly related to momentum or volatility, helping traders gauge the strength of trends.
Support Line Cross:
A shape ("●") is plotted when the close price crosses above a calculated support line, which could be a buy signal.
Generate Trading Signals:
Bullish and Bearish Trends:
Use the crossover of bullish_ema and bearish_ema to identify potential trend changes.
Overbought/Oversold Conditions:
Use the High-Low Boundary Line to identify overbought or oversold levels.
Specific Market Conditions:
Use the lines for "Danger and Caution," "Sell Signal," "Weak Out Strong Stay," "Opportunity," "Low Suck," and "High Sell" to identify specific market conditions and potential reversals.
Support Line Cross:
Use the plotted shape to identify potential buy signals when the close price crosses above the support line.
Risk Management:
Use the indicator in conjunction with other tools and risk management strategies to confirm trading signals and manage positions effectively.
LIMITATIONS
The script is based on historical data and does not guarantee future performance.
It is recommended to use the script in conjunction with other analysis tools.
The effectiveness of the strategy may vary depending on the market conditions and asset being traded.
NOTES
The script is designed for educational purposes and should not be considered financial advice.
Users are encouraged to backtest the strategy on a demo account before applying it to live trades.
THANKS
Special thanks to the TradingView community for their support and feedback.
在腳本中搜尋"the strat"

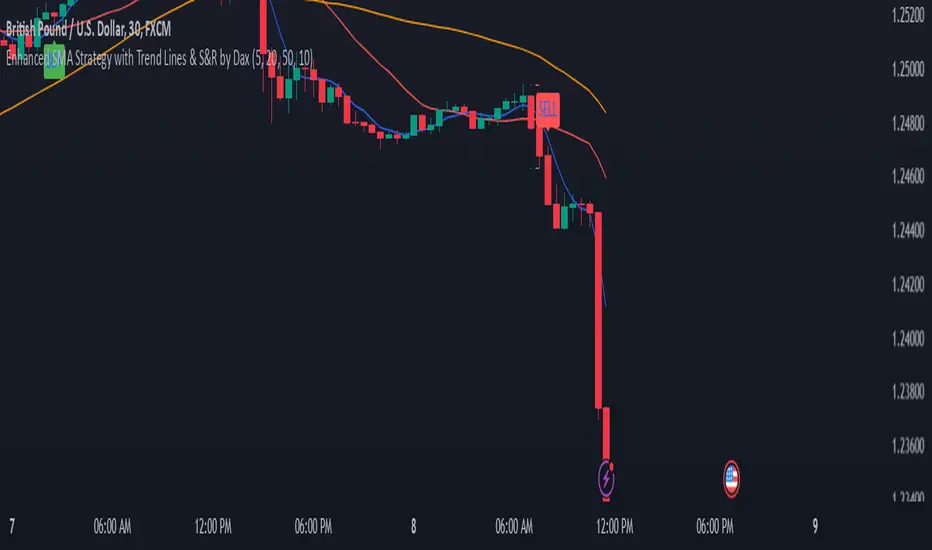
Enhanced SMA Strategy with Trend Lines & S&R by DaxThe Enhanced SMA Strategy with Trend Lines & Support/Resistance (S&R) by Dax indicator is a technical analysis tool designed to improve trading decisions by combining the simplicity of the Simple Moving Average (SMA) with the insight provided by trend lines and support/resistance levels. This hybrid approach aims to create a more robust and reliable trading strategy.
Key Components:
Simple Moving Average (SMA):
SMA is a basic trend-following indicator that calculates the average of a set of price data over a specified period. It helps identify the direction of the market, such as whether an asset is in an uptrend or downtrend.
The Enhanced SMA Strategy may use multiple SMAs, such as short-term (e.g., 20-period) and long-term (e.g., 50-period), to detect crossovers that signal buy or sell opportunities. For example, a bullish crossover occurs when a short-term SMA crosses above a long-term SMA, indicating a potential buying signal, while a bearish crossover signals a potential sell.
Trend Lines:
Trend lines are drawn on the price chart to visually identify the direction of the market, acting as dynamic support and resistance levels. A trend line is drawn by connecting two or more price points that demonstrate the overall price movement.
Trend lines can help traders see potential breakout or breakdown points. A price breaking above a downtrend line or below an uptrend line often signals a trend reversal.
Support and Resistance (S&R):
Support levels are price levels where an asset tends to find buying interest and stop falling, while Resistance levels are points where selling pressure emerges and prevent the price from rising further.
These levels are critical in determining where price reversals or consolidations are likely to occur. Enhanced S&R indicators can automatically identify these levels and draw horizontal lines at these critical points on the chart.
Combining S&R with SMA can help traders decide whether a breakout or bounce is likely at these levels, increasing the odds of a successful trade.
How It Works:
Trend Identification: The SMA is used to determine the trend direction. A rising SMA indicates an uptrend, while a falling SMA suggests a downtrend.
Signal Generation: The strategy often uses a combination of SMA crossovers (bullish or bearish) along with the confirmation of price action near trend lines and support/resistance levels. For example:
If a price breaks above resistance and the short-term SMA crosses above the long-term SMA, a buy signal is confirmed.
Conversely, if the price breaks below support and the short-term SMA crosses below the long-term SMA, a sell signal is given.
Dynamic Support/Resistance: Trend lines are drawn automatically or manually to spot areas where price might reverse. The Enhanced SMA Strategy checks if the price is close to these levels, providing a more precise entry/exit point based on the broader market context.
Advantages of the Enhanced SMA Strategy with Trend Lines & S&R:
Improved Accuracy: By combining trend-following (SMA) with key levels like trend lines and S&R, the strategy filters out false signals, leading to more reliable trade setups.
Trend Confirmation: The use of trend lines and S&R confirms the broader market context, reducing the risk of trading against the trend or entering at weak price points.
Flexible: This strategy can be applied to various timeframes, from short-term day trading to longer-term swing trading.
Visual Clarity: The combination of trend lines, S&R, and moving averages provides a clear and visually intuitive strategy for identifying key price levels and trend shifts.
How to Use It:
Draw Trend Lines: Identify the most recent price peaks and troughs to draw trend lines, marking the potential resistance and support levels.
Use SMAs: Apply two different-period SMAs to detect the trend (e.g., 20-period and 50-period). Pay attention to crossovers for buy/sell signals.
Watch for Breakouts or Reversals: Monitor how the price behaves at support or resistance levels and the trend lines. A price move beyond these levels, accompanied by a confirming SMA crossover, can signal a strong trade opportunity.
Conclusion:
The Enhanced SMA Strategy with Trend Lines & S&R by Dax is a powerful, multi-layered approach to technical analysis. It enhances the basic SMA strategy by incorporating additional tools like trend lines and support/resistance levels, which help traders make more informed decisions with higher accuracy. This method is suitable for both novice and experienced traders, offering clear trade signals while reducing the risk of false entries.
SufinBDThis TradingView script combines RSI, Stochastic RSI, MACD, and Bollinger Bands to generate Buy and Sell signals on two different timeframes: 4-hour (4H) and Daily (1D). The strategy aims to provide entry and exit points based on a multi-indicator confirmation approach, helping traders make more informed decisions.
Features:
RSI (Relative Strength Index):
Measures the speed and change of price movements.
The script looks for oversold conditions (RSI below 30) for buy signals and overbought conditions (RSI above 70) for sell signals.
Stochastic RSI:
Measures the level of RSI relative to its high-low range over a given period.
A Stochastic RSI below 0.2 indicates oversold conditions, and a value above 0.8 indicates overbought conditions.
It helps identify overbought and oversold conditions in a more precise manner than regular RSI.
MACD (Moving Average Convergence Divergence):
A trend-following momentum indicator that shows the relationship between two moving averages of a security's price.
The MACD line crossing above the Signal line generates bullish signals, and vice versa for bearish signals.
Bollinger Bands:
A volatility indicator that consists of a middle band (SMA of price), an upper band, and a lower band.
When the price is below the lower band, it signals potential buy opportunities, while prices above the upper band signal potential sell opportunities.
Timeframe Usage:
The script calculates indicators for both the 4-hour (4H) and Daily (1D) timeframes.
The combined signals from these two timeframes are used to generate Buy and Sell alerts.
Buy Signal:
A Buy signal is generated when all of the following conditions are met:
RSI on both 4H and 1D is below 30 (oversold conditions).
Stochastic RSI on both timeframes is below 0.2.
The MACD line is above the Signal line on both timeframes.
The price is below the lower Bollinger Band on both the 4H and 1D charts.
Sell Signal:
A Sell signal is generated when all of the following conditions are met:
RSI on both 4H and 1D is above 70 (overbought conditions).
Stochastic RSI on both timeframes is above 0.8.
The MACD line is below the Signal line on both timeframes.
The price is above the upper Bollinger Band on both the 4H and 1D charts.
Visuals:
Buy signals are marked with green labels below the bars.
Sell signals are marked with red labels above the bars.
Bollinger Bands are displayed on the chart with the upper and lower bands marked in blue (for 4H) and orange (for 1D).
Purpose:
This script aims to provide more reliable buy/sell signals by combining indicators across multiple timeframes. It is ideal for traders who want to use multiple confirmation points before entering or exiting a trade.
How to Use:
Apply the script to any chart on TradingView.
Look for Buy and Sell signals that meet the conditions above.
You can adjust the timeframe (e.g., 4H or 1D) based on your trading strategy.
This script can be used for intraday trading, swing trading, or position trading depending on your preferred timeframes.
Example of Signal Interpretation:
Buy Signal:
If all conditions are met (e.g., RSI is under 30, Stochastic RSI is under 0.2, MACD is bullish, and price is below the lower Bollinger Band on both the 4-hour and daily charts), the script will show a green "BUY" label below the price bar.
Sell Signal:
If all conditions are met (e.g., RSI is over 70, Stochastic RSI is over 0.8, MACD is bearish, and price is above the upper Bollinger Band on both timeframes), the script will show a red "SELL" label above the price bar.
This combination of indicators offers a multi-layered confirmation approach, which aims to reduce the risk of false signals and increase the reliability of your trading decisions.

Forex Pair Yield Momentum This Pine Script strategy leverages yield differentials between the 2-year government bond yields of two countries to trade Forex pairs. Yield spreads are widely regarded as a fundamental driver of currency movements, as highlighted by international finance theories like the Interest Rate Parity (IRP), which suggests that currencies with higher yields tend to appreciate due to increased capital flows:
1. Dynamic Yield Spread Calculation:
• The strategy dynamically calculates the yield spread (yield_a - yield_b) for the chosen Forex pair.
• Example: For GBP/USD, the spread equals US 2Y Yield - UK 2Y Yield.
2. Momentum Analysis via Bollinger Bands:
• Yield momentum is computed as the difference between the current spread and its moving
Bollinger Bands are applied to identify extreme deviations:
• Long Entry: When momentum crosses below the lower band.
• Short Entry: When momentum crosses above the upper band.
3. Reversal Logic:
• An optional checkbox reverses the trading logic, allowing long trades at the upper band and short trades at the lower band, accommodating different market conditions.
4. Trade Management:
• Positions are held for a predefined number of bars (hold_periods), and each trade uses a fixed contract size of 100 with a starting capital of $20,000.
Theoretical Basis:
1. Yield Differentials and Currency Movements:
• Empirical studies, such as Clarida et al. (2009), confirm that interest rate differentials significantly impact exchange rate dynamics, especially in carry trade strategies .
• Higher-yields tend to appreciate against lower-yielding currencies due to speculative flows and demand for higher returns.
2. Bollinger Bands for Momentum:
• Bollinger Bands effectively capture deviations in yield momentum, identifying opportunities where price returns to equilibrium (mean reversion) or extends in trend-following scenarios (momentum breakout).
• As Bollinger (2001) emphasized, this tool adapts to market volatility by dynamically adjusting thresholds .
References:
1. Dornbusch, R. (1976). Expectations and Exchange Rate Dynamics. Journal of Political Economy.
2. Obstfeld, M., & Rogoff, K. (1996). Foundations of International Macroeconomics.
3. Clarida, R., Davis, J., & Pedersen, N. (2009). Currency Carry Trade Regimes. NBER.
4. Bollinger, J. (2001). Bollinger on Bollinger Bands.
5. Mendelsohn, L. B. (2006). Forex Trading Using Intermarket Analysis.

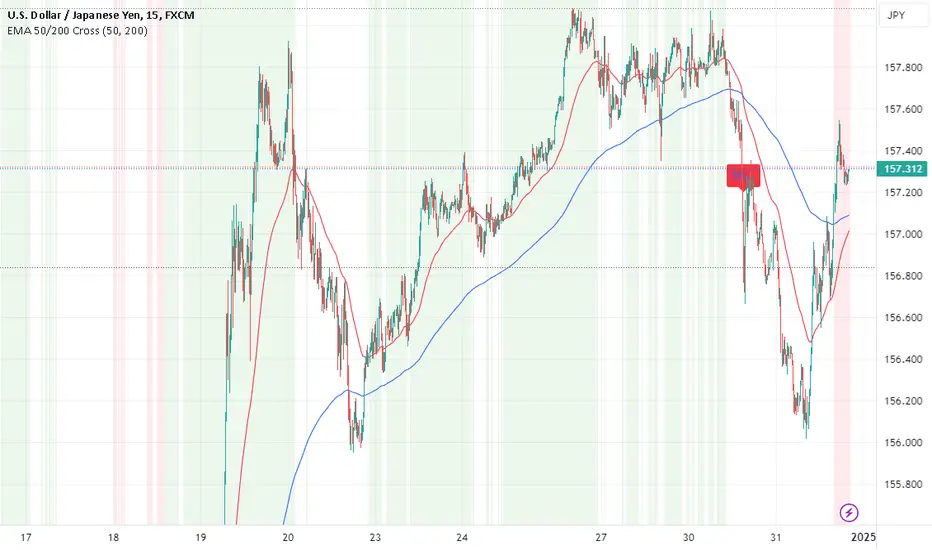
EMA Crossover Strategy with 50 & 200 EMAs - Faisal AnwarThis indicator uses 50 and 200-day Exponential Moving Averages (EMAs) to identify significant trend directions and potential trading opportunities through golden crossovers and death crosses. It highlights the role of EMAs as dynamic support in uptrends and downtrends, enhancing trend-following strategies.
Detailed Explanation:
EMAs Used:
The strategy utilizes two key EMAs — the 50-day EMA and the 200-day EMA. The 50-day EMA is often seen as a medium-term trend indicator, while the 200-day EMA is regarded as a benchmark for the long-term market trend.
Golden Crossover:
This occurs when the 50-day EMA crosses above the 200-day EMA, traditionally considered a bullish signal indicating potential long positions.
Death Cross:
This event is marked by the 50-day EMA crossing below the 200-day EMA, typically viewed as a bearish signal suggesting potential short positions.
Trend Support Identification:
The script also identifies when the price is above the 50-day EMA during an uptrend (indicating ongoing support) and when the price is above the 200-day EMA during a downtrend, suggesting the EMA is acting as resistance turning into support.
Visual Tools:
The indicator plots these EMAs on the chart with distinct colors for easy differentiation and uses background color changes to visually indicate when these EMAs act as support. Buy and sell signals are clearly marked with shapes and text directly on the chart for actionable insights.
Usage Tips:
Trading Decisions:
This indicator is best used in markets with clear trends, where EMAs can effectively identify shifts in momentum and serve as reliable support or resistance levels.
Complementary Tools:
Consider combining this EMA strategy with other technical analysis tools like RSI or MACD for confirmation of signals to enhance the reliability of the trading signals.
Ideal for:
Traders looking for a visual tool to assist in identifying trend directions and optimal points for entering or exiting trades based on established technical analysis principles.
Buy & Hold aka. HODL StrategyThis is a simply HODL or Buy & Hold strategy, which is super useful to see the risk and reward of such a strategy.
The benefit of using this strategy is that you also get to see the Max Drawdown (Risk).
This way you can compare it to the Net Profit (Reward) and decide if it's worth it for you.
This strategy buys on the Start Date and sells either on the End Date or on the last candle if the End Date is in the future.
Remember that the strategy must close the trade (sell) otherwise you don't see any results in the Strategy Tester (this is how it works).

IU 4 Bar UP StrategyIU 4 Bar UP Strategy
The IU 4 Bar UP Strategy is a trend-following strategy designed to identify and execute long trades during strong bullish momentum, combined with confirmation from the SuperTrend indicator. This strategy is suitable for traders aiming to capitalize on sustained upward market movements.
Features :
1. SuperTrend Confirmation: Incorporates the SuperTrend indicator as a dynamic support/resistance line to filter trades in the direction of the trend.
2. 4 Consecutive Bullish Bars: Detects a series of 4 bullish candles as a signal for strong upward momentum, ensuring robust trade setups.
3. Dynamic Alerts: Sends alerts for trade entries and exits to keep traders informed.
4. Visual Enhancements:
- Plots the SuperTrend indicator on the chart.
- Changes the background color while a trade is active for easy visualization.
Inputs :
- SuperTrend ATR Period: The period used to calculate the Average True Range (ATR) for the SuperTrend indicator.
- SuperTrend ATR Factor: The multiplier for the ATR in the SuperTrend calculation.
Entry Conditions :
A long entry is triggered when:
1. The last 4 consecutive candles are bullish (closing prices are higher than opening prices).
2. The current price is above the SuperTrend line.
3. The strategy is not already in a position.
4. The bar is confirmed (not a partially formed bar).
When all these conditions are met, the strategy enters a long position and provides an alert:
"Long Entry triggered"
Exit Conditions :
The strategy exits the long position when:
1. The closing price drops below the SuperTrend line.
2. An alert is generated: "Close the long Trade"
Visualization :
- The SuperTrend line is plotted, dynamically colored:
- Green when the trend is bullish.
- Red when the trend is bearish.
- The background color turns semi-transparent green while a trade is active, indicating a long position.
Do use proper risk management while using this strategy.

MERCURY-PRO by DrAbhiramSivprasd“MERCURYPRO”
The MERCURYPRO indicator is a custom technical analysis tool designed to provide dynamic trend signals based on a combination of the Chande Momentum Oscillator (CMO) and Standard Deviation (StDev). This indicator helps traders identify trend reversals or continuation based on the behavior of the price and momentum.
Key Features:
• Source Input: The indicator works with any price data, with the default set to close, which represents the closing price of each bar.
• Length Input: A period (default value 9) is used to determine the calculation window for the Chande Momentum Oscillator and Standard Deviation.
• Fixed CMO Length Option: Users can choose whether to use a fixed CMO length of 9 or adjust the length to the user-defined pds value.
• Calculation Method: The indicator allows switching between using the Chande Momentum Oscillator (CMO) or Standard Deviation (StDev) for the momentum calculation.
• Alpha: The smoothing factor used in the calculation of the MERCURYPRO value, which is based on the length of the period input (pds).
Core Calculation:
1. Momentum Calculation: The script calculates the momentum by determining the change in the source price (e.g., close) from one period to the next.
2. Chande Momentum Oscillator (CMO): The positive and negative momentum components are calculated and then summed over the specified period. This value is normalized to a percentage to determine the momentum strength.
3. K Value Calculation: The script selects either the CMO or Standard Deviation (depending on the user setting) to calculate the k value, which represents the dynamic price momentum.
4. MERCURYPRO Line: The final output of the indicator, MERCURYPRO, is computed using a weighted average of the k value and the previous MERCURYPRO value. The line is smoothed using the Alpha parameter.
Plot and Signal Generation:
• Color Coding: The line is color-coded based on the direction of MERCURYPRO:
• Blue: The trend is bullish (MERCURYPRO is rising).
• Maroon: The trend is bearish (MERCURYPRO is falling).
• Default Blue: Neutral or sideways market conditions.
• Plotting: The MERCURYPRO line is plotted with varying colors depending on the trend direction.
Alerts:
• Color Change Alert: The indicator has an alert condition based on when the MERCURYPRO line crosses its previous value. This helps traders stay informed about potential trend reversals or continuation signals.
Use Case:
• Trend Confirmation: Traders can use the MERCURYPRO indicator to identify whether the market is in a strong trend or not.
• Signal for Entries/Exits: The color change and crossovers of the MERCURYPRO line can be used as entry or exit signals, depending on the trader’s strategy.
Overall Purpose:
The MERCURYPRO indicator combines momentum analysis with smoothing techniques to offer a dynamic, responsive tool for identifying market trends and potential reversals. It is particularly useful in conjunction with other technical indicators to provide confirmation for trade setups.
How to Use the MERCURYPRO Indicator:
The MERCURYPRO indicator is designed to help traders identify trend reversals and market conditions. Here are a few ways you can use it:
1. Trend Confirmation (Bullish or Bearish)
• Bullish Trend: When the MERCURYPRO line is colored Blue, it indicates a rising trend, suggesting that the market is bullish.
• Action: You can consider entering long positions when the line turns blue, or holding your existing positions if you’re already long.
• Bearish Trend: When the MERCURYPRO line is colored Maroon, it signals a downward trend, indicating a bearish market.
• Action: You may consider entering short positions or closing any long positions when the line turns maroon.
2. Trend Reversal Alerts
• Color Change: The MERCURYPRO indicator changes color when there’s a trend reversal. The alert condition triggers when the MERCURYPRO crosses above or below its previous value, signaling a potential shift in the trend.
• Action: You can use this alert as a signal to monitor potential entry or exit points for trades. For example, a crossover from maroon to blue could indicate a potential buying opportunity, while a crossover from blue to maroon could suggest a selling opportunity.
3. Use with Other Indicators for Confirmation
• While the MERCURYPRO provides valuable trend insights, it’s often more effective when used in combination with other indicators like RSI (Relative Strength Index), MACD, or moving averages to confirm signals.
• Example: If MERCURYPRO turns blue and RSI is above 50, it may signal a strong bullish trend, enhancing the confidence to enter a long trade.
4. Divergence
• Watch for divergence between the MERCURYPRO line and the price chart:
• Bullish Divergence: If the price makes new lows while MERCURYPRO is showing higher lows, it suggests a potential bullish reversal.
• Bearish Divergence: If the price makes new highs while MERCURYPRO is showing lower highs, it suggests a potential bearish reversal.
Example of Use:
• Example 1: If the MERCURYPRO line changes from maroon to blue, you might enter a long position. After the MERCURYPRO line turns blue, use an alert to monitor the price action. If other indicators (like RSI) also suggest strength, your confidence in the trade will increase.
• Example 2: If the MERCURYPRO line shifts from blue to maroon, it could be a signal to close long positions and consider shorting the market if other conditions align (e.g., moving averages also turn bearish).
Warning for Using the MERCURYPRO Indicator:
1. Lagging Indicator:
• The MERCURYPRO is a lagging indicator, meaning it responds to price changes after they have occurred. This may delay entry and exit signals, and it’s crucial to combine it with other leading indicators to get timely information.
2. False Signals in Range-bound Markets:
• In choppy or sideways markets, the MERCURYPRO line can produce false signals, flipping between blue and maroon frequently without showing a clear trend. It’s important to avoid trading based on these false signals when the market is not trending.
3. Overreliance on One Indicator:
• Relying solely on MERCURYPRO can be risky. Always confirm signals with additional tools like volume analysis, price action, or other indicators to increase the accuracy of your trades.
4. Market Conditions Matter:
• The indicator may work well in trending markets, but in highly volatile or news-driven environments, it may provide misleading signals. Ensure that you take market fundamentals and external news events into consideration before acting on the indicator’s signals.
5. Risk Management:
• As with any technical indicator, MERCURYPRO is not infallible. Always use appropriate risk management techniques such as stop-loss orders to protect your capital. Never risk more than you can afford to lose on a trade.
6. Backtest First:
• Before implementing MERCURYPRO in live trading, make sure to backtest it on historical data. Test the strategy with various market conditions to assess its effectiveness and identify any potential weaknesses.
By considering these guidelines and warnings, you can use the MERCURYPRO indicator more effectively and mitigate potential risks in your trading strategy.

Temporary Help Services Jobs - Trend Allocation StrategyThis strategy is designed to capitalize on the economic trends represented by the Temporary Help Services (TEMPHELPS) index, which is published by the Federal Reserve Economic Data (FRED). Temporary Help Services Jobs are often regarded as a leading indicator of labor market conditions, as changes in temporary employment levels frequently precede broader employment trends.
Methodology:
Data Source: The strategy uses the FRED dataset TEMPHELPS for monthly data on temporary help services.
Trend Definition:
Uptrend: When the current month's value is greater than the previous month's value.
Downtrend: When the current month's value is less than the previous month's value.
Entry Condition: A long position is opened when an uptrend is detected, provided no position is currently held.
Exit Condition: The long position is closed when a downtrend is detected.
Scientific Basis:
The TEMPHELPS index serves as a leading economic indicator, as noted in studies analyzing labor market cyclicality (e.g., Katz & Krueger, 1999). Temporary employment is often considered a proxy for broader economic conditions, particularly in predicting recessions or recoveries. Incorporating this index into trading strategies allows for aligning trades with potential macroeconomic shifts, as suggested by research on employment trends and market performance (Autor, 2001; Valetta & Bengali, 2013).
Usage:
This strategy is best suited for long-term investors or macroeconomic trend followers who wish to leverage labor market signals for equity or futures trading. It operates exclusively on end-of-month data, ensuring minimal transaction costs and noise.

IU open equal to high/low strategyIU open equal to high/low strategy:
The "IU Open Equal to High/Low Strategy" is designed to identify and trade specific market conditions where the day's first price action shows a strong directional bias. This strategy automatically enters trades based on the relationship between the market's open price and its first high or low of the day.
Entry Conditions:
1. Long Entry: A long position is initiated when the first open price of the session equals the day's first low. This signals a potential upward move.
2. Short Entry: A short position is initiated when the first open price of the session equals the day's first high. This signals a potential downward move.
Exit Conditions:
1. Stop Loss (SL): For both long and short trades, the stop loss is calculated based on the low or high of the candle where the position was entered.
2. Take Profit (TP): The take profit is set using a Risk-to-Reward (RTR) ratio, which is customizable by the user. The TP is calculated relative to the entry price and the distance between the entry and the stop loss.
Additional Features:
- Plots are used to visualize the entry price, stop loss, and take profit levels directly on the chart, providing clear and actionable insights.
- Labels are displayed to indicate the occurrence of the "Open == Low" or "Open == High" conditions for easier identification of potential trade setups.
- A dynamic fill highlights the areas between the entry price and the stop loss or take profit, offering a clear visual representation of the trade's risk and reward zones.
This strategy is designed for traders looking to capitalize on directional momentum at the start of the trading session. It is customizable, allowing users to set their desired Risk-to-Reward ratio and tailor the strategy to fit their trading style.

TearRepresentative's Rule-Based Dip Buying Strategy Rule-Based Dip Buying Strategy Indicator
This TradingView indicator, inspired by TearRepresentative [ , is a refined tool designed to assist traders in implementing a rule-based dip buying strategy. The indicator automates the identification of optimal buy and sell points, helping traders stay disciplined and minimize emotional biases. It is tailored to index trading, specifically leveraged ETFs like SPXL, to capture opportunities in market pullbacks and recoveries.
Key Features
Dynamic Buy Levels:
Tracks the local high over a customizable lookback period and calculates three buy levels based on percentage drops from the high:
Buy Level 1: First entry point (e.g., 15% drop).
Buy Level 2: Second entry point (e.g., additional 10% drop).
Buy Level 3: Third entry point (e.g., additional 7% drop).
Average Price Tracking:
Dynamically calculates the average price for entered positions when multiple buy levels are triggered.
Sell Level:
Computes a take-profit level (e.g., 20% above the average price) to automate profit-taking when the market rebounds.
Signal Visualization:
Buy Signals: Displayed as green triangles at each buy level.
Sell Signals: Displayed as red triangles at the sell level.
Alerts:
Configurable alerts notify traders when buy or sell signals are triggered, ensuring no opportunity is missed.
Visual Aids:
Semi-transparent and dynamic lines represent buy and sell levels for clear visualization.
Labels provide additional clarity for active levels, helping traders quickly identify actionable signals.
How It Works
The indicator analyzes market movements to identify dips based on predefined thresholds.
Buy signals are triggered when the market price reaches specified levels below the local high.
Once a position is taken, the indicator dynamically adjusts the average entry price and calculates the corresponding sell level.
A sell signal is generated when the market price rises above the calculated take-profit level.
Why Use This Indicator?
Discipline: Automates decision-making, removing emotional factors from trading.
Clarity: Provides clear entry and exit points to simplify complex market dynamics.
Versatility: Suitable for all market conditions, especially during pullbacks and rebounds.
Customization: Allows traders to tailor parameters to their preferred trading style and risk tolerance.
Acknowledgment
This indicator is based on the strategy and insights provided by TearRepresentative, whose expertise in rule-based trading has inspired countless traders. TearRepresentative's approach emphasizes simplicity, reliability, and consistency, offering a robust framework for long-term success.

MFS-3 Bars Pattern Strategy3 Bar Pattern Strategy
Detects an Ignite Candle followed by a Pullback Candle followed by a Confirmation Candle.
A Box will be drawn around the setup and three arrows will identify I, P, C (Ignite, Pullback, Confirmation) the setup.
The strategy will calculate a Stop Loss below the Low Price of the Ignite candle and a Take Profit at 2 times the Stop Loss giving a Risk to Reward Ratio of 1:2.
Extra conditions are included to reduce false triggers:
- A down trend must be detected using 3 SMA (Long, Medium, Short) that should be aligned from Long to Short one above the other.
- The Ignite Candle's body must be BELOW the Short SMA
An input form is available to adjust some strategy parameters.
Performance Note
----------------------
Trading conditions are very strict, so most of the time, no signals will be detected in the Strategy window.
This strategy should only be one of many strategies used for trade setups.
Hope you enjoy it.

MCP Stop Strategy [JARUTIR]The MCP Stop Strategy is a trading tool designed to help traders lock in profits and manage risks. It is based on the concept of setting a MCP (Mental Capacity Preservation) Stop explained in the book "The Lifecycle Trade". I call it Maximum Controllable Profit Stop which helps protect profits once a stock or asset reaches a new peak. The MCP Stop is dynamically calculated based on the Buy Price and the All Time High Price (Peak Price), and is adjusted using a customizable percentage (MCP%) to retain a portion of the gains from the peak price during a drawdown.
Key Features :
MCP Stop Calculation: The script calculates the MCP Stop as:
MCP Stop = Buy Price + (Peak Price - Buy Price) x MCP%
This helps you protect a portion of your gains (defined by MCP%) as the price moves in your favor.
Flexible Buy Date Option:
You can either manually input a Buy Date or let the script automatically detect the Buy Date when the price first meets or exceeds the user-defined Buy Price.
After the Buy Date, the MCP Stop, Buy Price, and Peak Price are plotted on the chart for easy visualization.
Customizable Parameters:
Buy Price: The price at which the asset was bought.
MCP Percentage: The percentage of profit from the peak that you want to retain in case of a drawdown.
Lookback Length: The number of bars to consider when calculating the Peak Price (All Time High).
How to Use the Script :
Set the Buy Price: Enter the price at which you bought the asset.
Set the MCP%: Enter the percentage of profits you want to protect from the peak. For example, if you want to retain 10% of the gain from the peak, set this to 10.
Choose the Buy Date Method:
Automated Buy Date: The script will automatically detect the first bar where the price meets or exceeds the Buy Price.
Manual Buy Date: If you prefer to specify a particular Buy Date, input the desired date and time.
View the MCP Stop and Peak Price: After the Buy Date (either manually or automatically detected), the MCP Stop, Buy Price, and Peak Price will be plotted on the chart.
Monitor the MCP Stop Trigger: The script will alert you when the price falls below the MCP Stop, indicating a potential exit point to protect profits.
Frequently Asked Questions (FAQs):
1. What is the MCP Stop?
The MCP Stop is a dynamic stop-loss level that adjusts based on your Buy Price and the All Time High Price (Peak Price). It protects a portion of your gains from the peak, which is defined by the MCP%. For example, if you set the MCP% to 10%, the script will retain 10% of the gains from the peak and use this as a stop-loss.
2. How does the Buy Date work?
The Buy Date is the date when you entered the position:
If you choose Automated Buy Date, the script will automatically set the Buy Date to the first bar when the price meets or exceeds the Buy Price.
If you choose Manual Buy Date, you can specify a particular date and time when you want the strategy to start calculating and plotting the MCP Stop and Peak Price.
3. What happens if the price falls below the MCP Stop?
If the price drops below the MCP Stop, the script will mark this as a potential exit point, helping you protect profits. A visual alert (MCP STOP) will be shown on the chart when the price reaches or falls below the MCP Stop.
4. Can I adjust the Lookback Length for Peak Price?
Yes, you can customize the Lookback Length (the number of bars the script considers when calculating the Peak Price) by entering a value in the input field. By default, it is set to 1000 bars, which represents a few months of historical data, but you can increase or decrease this based on your trading strategy.
5. Why would I want to use the automated Buy Date?
The Automated Buy Date is useful for traders who want the script to automatically track the Buy Date when the price first reaches or exceeds the Buy Price. This is helpful when you're unsure of the exact entry date but know the price at which you bought the asset. It simplifies the process by eliminating the need for manual input.
6. Can I use this strategy for long and short positions?
The current version of this script is designed for long positions, where you buy an asset and want to protect your profits as the price increases. If you're interested in applying it to short positions, you would need to adjust the logic accordingly (e.g., tracking the lowest price instead of the peak price).
7. Can I modify the script to fit my trading strategy?
Yes, this script is highly customizable. You can adjust parameters such as Buy Price, MCP%, and Lookback Length to suit your specific trading style. You can also tweak the visual appearance of the plotted lines and alerts.
Disclaimer:
This strategy is intended for educational purposes only. It should not be considered financial advice. Always perform your own research and consult with a professional before making any trading decisions. Trading involves significant risk, and you should never trade with money you cannot afford to lose.

RSI and Bollinger Bands Screener [deepakks444]Indicator Overview
The indicator is designed to help traders identify potential long signals by combining the Relative Strength Index (RSI) and Bollinger Bands across multiple timeframes. This combination allows traders to leverage the strengths of both indicators to make more informed trading decisions.
Understanding RSI
What is RSI?
The Relative Strength Index (RSI) is a momentum oscillator that measures the speed and change of price movements. Developed by J. Welles Wilder Jr. for stocks and forex trading, the RSI is primarily used to identify overbought or oversold conditions in an asset.
How RSI Works:
Calculation: The RSI is calculated using the average gains and losses over a specified period, typically 14 periods.
Range: The RSI oscillates between 0 and 100.
Interpretation:
Key Features of RSI:
Momentum Indicator: RSI helps identify the momentum of price movements.
Divergences: RSI can show divergences, where the price makes a higher high, but the RSI makes a lower high, indicating potential reversals.
Trend Identification: RSI can also help identify trends. In an uptrend, the RSI tends to stay above 50, and in a downtrend, it tends to stay below 50.
Understanding Bollinger Bands
What is Bollinger Bands?
Bollinger Bands are a type of trading band or envelope plotted two standard deviations (positively and negatively) away from a simple moving average (SMA) of a price. Developed by financial analyst John Bollinger, Bollinger Bands consist of three lines:
Upper Band: SMA + (Standard Deviation × Multiplier)
Middle Band (Basis): SMA
Lower Band: SMA - (Standard Deviation × Multiplier)
How Bollinger Bands Work:
Volatility Measure: Bollinger Bands measure the volatility of the market. When the bands are wide, it indicates high volatility, and when the bands are narrow, it indicates low volatility.
Price Movement: The price tends to revert to the mean (middle band) after touching the upper or lower bands.
Support and Resistance: The upper and lower bands can act as dynamic support and resistance levels.
Key Features of Bollinger Bands:
Volatility Indicator: Bollinger Bands help traders understand the volatility of the market.
Mean Reversion: Prices tend to revert to the mean (middle band) after touching the bands.
Squeeze: A Bollinger Band Squeeze occurs when the bands narrow significantly, indicating low volatility and a potential breakout.
Combining RSI and Bollinger Bands
Strategy Overview:
The strategy aims to identify potential long signals by combining RSI and Bollinger Bands across multiple timeframes. The key conditions are:
RSI Crossing Above 60: The RSI should cross above 60 on the 15-minute timeframe.
RSI Above 60 on Higher Timeframes: The RSI should already be above 60 on the hourly and daily timeframes.
Price Above 20MA or Walking on Upper Bollinger Band: The price should be above the 20-period moving average of the Bollinger Bands or walking on the upper Bollinger Band.
Strategy Details:
RSI Calculation:
Calculate the RSI for the 15-minute, 1-hour, and 1-day timeframes.
Check if the RSI crosses above 60 on the 15-minute timeframe.
Ensure the RSI is above 60 on the 1-hour and 1-day timeframes.
Bollinger Bands Calculation:
Calculate the Bollinger Bands using a 20-period moving average and 2 standard deviations.
Check if the price is above the 20-period moving average or walking on the upper Bollinger Band.
Entry and Exit Signals:
Long Signal: When all the above conditions are met, consider a long entry.
Exit: Exit the trade when the price crosses below the 20-period moving average or the stop-loss is hit.
Example Usage
Setup:
Add the indicator to your TradingView chart.
Configure the inputs as per your requirements.
Monitoring:
Look for the long signal on the chart.
Ensure that the RSI is above 60 on the 15-minute, 1-hour, and 1-day timeframes.
Check that the price is above the 20-period moving average or walking on the upper Bollinger Band.
Trading:
Enter a long position when the criteria are met.
Set a stop-loss below the low of the recent 15-minute candle or based on your risk management rules.
Monitor the trade and exit when the RSI returns below 60 on any of the timeframes or when the price crosses below the 20-period moving average.
House Rules Compliance
No Financial Advice: This strategy is for educational purposes only and should not be construed as financial advice.
Risk Management: Always use proper risk management techniques, including stop-loss orders and position sizing.
Past Performance: Past performance is not indicative of future results. Always conduct your own research and analysis.
TradingView Guidelines: Ensure that any shared scripts or strategies comply with TradingView's terms of service and community guidelines.
Conclusion
This strategy combines RSI and Bollinger Bands across multiple timeframes to identify potential long signals. By ensuring that the RSI is above 60 on higher timeframes and that the price is above the 20-period moving average or walking on the upper Bollinger Band, traders can make more informed decisions. Always remember to conduct thorough research and use proper risk management techniques.

[blackcat] L1 Simple Dual Channel Breakout█ OVERVIEW
The script " L1 Simple Dual Channel Breakout" is an indicator designed to plot dual channel breakout bands and their long-term EMAs on a chart. It calculates short-term and long-term moving averages and deviations to establish upper, lower, and middle bands, which traders can use to identify potential breakout opportunities.
█ LOGICAL FRAMEWORK
Structure:
The script is structured into several main sections:
• Input Parameters: The script does not explicitly define input parameters for the user to adjust, but it uses default values for short_term_length (5) and long_term_length (181).
• Calculations: The calculate_dual_channel_breakout function performs the core calculations, including the blast condition, typical price, short-term and long-term moving averages, and dynamic moving averages.
• Plotting: The script plots the short-term bands (upper, lower, and middle) and their long-term EMAs. It also plots conditional line breaks when the short-term bands cross the long-term EMAs.
Flow of Data and Logic:
1 — The script starts by defining the calculate_dual_channel_breakout function.
2 — Inside the function, it calculates various moving averages and deviations based on the input prices and lengths.
3 — The function returns the calculated bands and EMAs.
4 — The script then calls this function with predefined lengths and plots the resulting bands and EMAs on the chart.
5 — Conditional plots are added to highlight breakouts when the short-term bands cross the long-term EMAs.
█ CUSTOM FUNCTIONS
The script defines one custom function:
• calculate_dual_channel_breakout(close_price, high_price, low_price, short_term_length, long_term_length): This function calculates the short-term and long-term bands and EMAs. It takes five parameters: close_price, high_price, low_price, short_term_length, and long_term_length. It returns an array containing the upper band, lower band, middle band, long-term upper EMA, long-term lower EMA, and long-term middle EMA.
█ KEY POINTS AND TECHNIQUES
• Typical Price Calculation: The script uses a modified typical price calculation (2 * close_price + high_price + low_price) / 4 instead of the standard (high_price + low_price + close_price) / 3.
• Short-term and Long-term Bands: The script calculates short-term bands using a simple moving average (SMA) of the typical price and long-term bands using a relative moving average (RMA) of the close price.
• Conditional Plotting: The script uses conditional plotting to highlight breakouts when the short-term bands cross the long-term EMAs, enhancing visual identification of trading signals.
• EMA for Long-term Trends: The use of Exponential Moving Averages (EMAs) for long-term bands helps in smoothing out short-term fluctuations and focusing on long-term trends.
█ EXTENDED KNOWLEDGE AND APPLICATIONS
• Modifications: Users can add input parameters to allow customization of short_term_length and long_term_length, making the indicator more flexible.
• Enhancements: The script could be extended to include alerts for breakout conditions, providing traders with real-time notifications.
• Alternative Bands: Users might experiment with different types of moving averages (e.g., WMA, HMA) for the short-term and long-term bands to see if they yield better results.
• Additional Indicators: Combining this indicator with other technical indicators (e.g., RSI, MACD) could provide a more comprehensive trading strategy.
• Backtesting: Users can backtest the strategy using Pine Script's strategy functions to evaluate its performance over historical data.

Precision Trading Strategy: Golden EdgeThe PTS: Golden Edge strategy is designed for scalping Gold (XAU/USD) on lower timeframes, such as the 1-minute chart. It captures high-probability trade setups by aligning with strong trends and momentum, while filtering out low-quality trades during consolidation or low-volatility periods.
The strategy uses a combination of technical indicators to identify optimal entry points:
1. Exponential Moving Averages (EMAs): A fast EMA (3-period) and a slow EMA (33-period) are used to detect short-term trend reversals via crossover signals.
2. Hull Moving Average (HMA): A 66-period HMA acts as a higher-timeframe trend filter to ensure trades align with the overall market direction.
3. Relative Strength Index (RSI): A 12-period RSI identifies momentum. The strategy requires RSI > 55 for long trades and RSI < 45 for short trades, ensuring entries are backed by strong buying or selling pressure.
4. Average True Range (ATR): A 14-period ATR ensures trades occur only during volatile conditions, avoiding choppy or low-movement markets.
By combining these tools, the PTS: Golden Edge strategy creates a precise framework for scalping and offers a systematic approach to capitalize on Gold’s price movements efficiently.

Structure Pilot Vision [Wang Indicators]Built and refined with Dave Teaches, the HTF Vision Pro supercharges the trader, providing them with the tools to approach price with a layered analysis.
Providing the trader the instruments to put on the spotlight significant zones to anticipate price deliveries
HTF CANDLE VISION
Displays up to 3 series of HTF Candles
Shows candlesticks from a higher time frame (e.g., daily, 4-hour, weekly) on a lower time frame chart (e.g., 1-hour, 15-minute). This allows traders to simultaneously observe both short-term and long-term market dynamics.
Customizable Time Frames: Users can select any higher time frame to overlay on the current chart. Common time frames include daily, weekly, and monthly candles, but other custom time frames can also be used.
Color Coding: The HTF candles are color-coded for easy differentiation from the lower time frame candles. Users can customize colors to suit their preferences.
Open, High, Low, Close (OHLC) Representation: The indicator displays the full candlestick pattern for the chosen HTF, including the open, high, low, and close values. This helps traders easily identify key price levels and trends.
Settings :
Number of candles
Space between the chart and the HTF candles
Space between candles sets
Size : from Tiny (2x regular candle size) to Large (x8 regular candle size)
Space between candles
Colors of candles, borders and wicks
Incorporating a Higher Time Frame (HTF) candle into your Lower Time Frame (LTF) chart can be immensely beneficial for traders looking to enhance their analysis and decision-making process.
Use Cases for HTF Candles on LTF Charts:
Trend Confirmation:
Use Case: A trader might be looking at a 15-minute chart (LTF) but wants to confirm if the short-term trends align with the daily trend (HTF). Plotting a daily candle on the 15-minute chart helps visualize whether the short-term movements are part of a broader, longer-term trend.
Support and Resistance Identification:
Use Case: By plotting a weekly candle on a daily chart, traders can quickly identify levels that have acted as significant support or resistance in the past on the higher time frame, which might not be as visible or influential on the daily chart alone.
Entry and Exit Points Enhancement:
Use Case: When preparing to enter a trade based on a 1-hour chart, overlaying a 4-hour candle can provide insights into potential reversal points or continuation patterns that are more significant on the higher time frame, thus refining entry and exit strategies.
Volatility and Breakout Analysis:
Use Case: Seeing how a single HTF candle (like a monthly candle on a weekly chart) closes can give traders an idea of the market's volatility or the strength behind breakouts. A long wick on the HTF candle might suggest a rejected breakout or a potential reversal.
Risk Management:
Use Case: Using an HTF candle can help set more informed stop-loss levels. For instance, if a trader uses a 4-hour candle on a 1-hour chart, they might place their stop-loss just beyond the low of the HTF candle, assuming this represents a significant level of support or resistance.
Contextual Trading Decisions:
Use Case: For scalpers or day traders, understanding where the current price action sits within the context of a higher timeframe can lead to better decision-making. For instance, trading within an HTF consolidation range might suggest less aggressive moves, while being near the top or bottom of such a range might indicate potential for larger movements.
Market Sentiment Analysis:
Use Case: The color (red for bearish, green for bullish) and size of the HTF candle can give a quick visual cue of the market sentiment over that period, helping traders assess whether they are going with or against the broader market flow.
Swing Trading:
Use Case: Swing traders might plot a weekly candle on a daily chart to align their trades with the direction of the weekly trend, ensuring they're not fighting the broader market momentum.
Educational and Visual Reference:
Use Case: For educational purposes, having an HTF candle overlay can serve as a visual reminder for students or new traders about how price movements on different time frames can influence each other, aiding in teaching concepts like "the trend is your friend."
Wang use cases :
The way it is intended to be used is as follow
If you trade the 1 min chart and have a set of 5 min HTF candles plotted on your charts it could be used as follow :
As long as the 5 min keep providing close below the last 5 min candle if you're short you're safe ... if the 5 min candle stop closing below the last ones and start giving up-close you should consider closing your trade
Another use of HTF Candle is to find fractals responsible (up or down internal mouv before the breakout that creates a new zone). This fractal acts as supply and demand zone responsible for maintening the trend or for a reversal.
See examples below :
These fractals are interesting zones because they often cause the price to react, so following a flip in the fractal, you can take a short in bearish zones and a long in bullish zones. Fractals are easier to detect thanks to the HTF candles function, and allow you to enter positions with greater confidence. They can be used in the same way as the 70%, 50% and 30% interest zones, or they can be used simultaneously.
Use with zones :
▫️ VERTICAL BARS VISION ▫️
The vertical bars provide a view of market fractality: on a low time frame chart, they show the size of a candle in a higher time frame, and thus give a better understanding of the price fractality essential to the strategy we use.
Example :
For your information, when you modify data in the vertical bars or HTF candles parameters, the two are synchronized automatically.
The Vertical HTF Candle Closures Indicator is a simple yet effective tool that helps traders visually track the closing times of higher time frame (HTF) candles (such as 4H, 1H, 15M) on a lower time frame chart (e.g., 1-minute).
This feature plots vertical lines on the chart at the exact closure time of each selected HTF, allowing traders to quickly recognize key moments when the HTF candles close, or better yet when we trade above / below the last one and reverse ''sweepy sweepy'' .
Its more like a vertical and more micro visualisation than the HTF Candles.
Wang usage :
its a great tool to be able to reverse engineer what's in a HTFcandle precisely its a good combination with HTF candle projections to train the eyes of the traders about Whats is inside a candle that formed on the higher time frame
Limitation & know issues :
The chart may become cluttered with too many lines if multiple time frames are selected. Adjusting the line style or disabling certain time frames can help reduce visual noise.
On low time frame (<30s), some bar may notshow exactly on time (e.g : in 10sec timeframe, the 15min bar can be displayed at 01:15:10 instead of 01:15:00).
Because of the data provider and the interpreter of Trading View, if there is not data for a candle, Trading view just "skip" the candle. Sometime, those skip are on the candle that goes to 15min, 1 hour or 4 hour. As this is a Trading View issue. There is pretty much nothing we can do.
Some users may experience vertical bars at 1am, 5am, 9am ... instead of 0am, 4am, 8am ... That is because of the difference between the Timezone set on the chart and the timezone of the market they trade. Vertical bar will always refer to the symbol displayed

MadTrend [InvestorUnknown]The MadTrend indicator is an experimental tool that combines the Median and Median Absolute Deviation (MAD) to generate signals, much like the popular Supertrend indicator. In addition to identifying Long and Short positions, MadTrend introduces RISK-ON and RISK-OFF states for each trade direction, providing traders with nuanced insights into market conditions.
Core Concepts
Median and Median Absolute Deviation (MAD)
Median: The middle value in a sorted list of numbers, offering a robust measure of central tendency less affected by outliers.
Median Absolute Deviation (MAD): Measures the average distance between each data point and the median, providing a robust estimation of volatility.
Supertrend-like Functionality
MadTrend utilizes the median and MAD in a manner similar to how Supertrend uses averages and volatility measures to determine trend direction and potential reversal points.
RISK-ON and RISK-OFF States
RISK-ON: Indicates favorable conditions for entering or holding a position in the current trend direction.
RISK-OFF: Suggests caution, signaling RISK-ON end and potential trend weakening or reversal.
Calculating MAD
The mad function calculates the median of the absolute deviations from the median, providing a robust measure of volatility.
// Function to calculate the Median Absolute Deviation (MAD)
mad(series float src, simple int length) =>
med = ta.median(src, length) // Calculate median
abs_deviations = math.abs(src - med) // Calculate absolute deviations from median
ta.median(abs_deviations, length) // Return the median of the absolute deviations
MADTrend Function
The MADTrend function calculates the median and MAD-based upper (med_p) and lower (med_m) bands. It determines the trend direction based on price crossing these bands.
MADTrend(series float src, simple int length, simple float mad_mult) =>
// Calculate MAD (volatility measure)
mad_value = mad(close, length)
// Calculate the MAD-based moving average by scaling the price data with MAD
median = ta.median(close, length)
med_p = median + (mad_value * mad_mult)
med_m = median - (mad_value * mad_mult)
var direction = 0
if ta.crossover(src, med_p)
direction := 1
else if ta.crossunder(src, med_m)
direction := -1
Trend Direction and Signals
Long Position (direction = 1): When the price crosses above the upper MAD band (med_p).
Short Position (direction = -1): When the price crosses below the lower MAD band (med_m).
RISK-ON: When the price moves further in the direction of the trend (beyond median +- MAD) after the initial signal.
RISK-OFF: When the price retraces towards the median, signaling potential weakening of the trend.
RISK-ON and RISK-OFF States
RISK-ON LONG: Price moves above the upper band after a Long signal, indicating strengthening bullish momentum.
RISK-OFF LONG: Price falls back below the upper band, suggesting potential weakness in the bullish trend.
RISK-ON SHORT: Price moves below the lower band after a Short signal, indicating strengthening bearish momentum.
RISK-OFF SHORT: Price rises back above the lower band, suggesting potential weakness in the bearish trend.
Picture below show example RISK-ON periods which can be identified by “cloud”
Note: Highlighted areas on the chart indicating RISK-ON and RISK-OFF periods for both Long and Short positions.
Implementation Details
Inputs and Parameters:
Source (input_src): The price data used for calculations (e.g., close, open, high, low).
Median Length (length): The number of periods over which the median and MAD are calculated.
MAD Multiplier (mad_mult): Determines the distance of the upper and lower bands from the median.
Calculations:
Median and MAD are recalculated each period based on the specified length.
Upper (med_p) and Lower (med_m) Bands are computed by adding and subtracting the scaled MAD from the median.
Visual representation of the indicator on a price chart:
Backtesting and Performance Metrics
The MadTrend indicator includes a Backtesting Mode with a performance metrics table to evaluate its effectiveness compared to a simple buy-and-hold strategy.
Equity Calculation:
Calculates the equity curve based on the signals generated by the indicator.
Performance Metrics:
Metrics such as Mean Returns, Standard Deviation, Sharpe Ratio, Sortino Ratio, and Omega Ratio are computed.
The metrics are displayed in a table for both the strategy and the buy-and-hold approach.
Note: Due to the use of labels and plot shapes, automatic chart scaling may not function ideally in Backtest Mode.
Alerts and Notifications
MadTrend provides alert conditions to notify traders of significant events:
Trend Change Alerts
RISK-ON and RISK-OFF Alerts - Provides real-time notifications about the RISK-ON and RISK-OFF states for proactive trade management.
Customization and Calibration
Default Settings: The provided default settings are experimental and not optimized. They serve as a starting point for users.
Parameter Adjustment: Traders are encouraged to calibrate the indicator's parameters (e.g., length, mad_mult) to suit their specific trading style and the characteristics of the asset being analyzed.
Source Input: The indicator allows for different price inputs (open, high, low, close, etc.), offering flexibility in how the median and MAD are calculated.
Important Notes
Market Conditions: The effectiveness of the MadTrend indicator can vary across different market conditions. Regular calibration is recommended.
Backtest Limitations: Backtesting results are historical and do not guarantee future performance.
Risk Management: Always apply sound risk management practices when using any trading indicator.

16. SMC Strategy with SL - low TimeframeOverview
The "SMC Strategy with SL - low Timeframe" is a comprehensive trading strategy that uses key concepts from Smart Money Theory to identify favorable areas in the market for buying or selling. This strategy takes advantage of price imbalances, support and resistance zones, and swing highs/lows to generate high-probability trade signals.
The key features of this strategy include:
Swing High/Low Analysis: Used to determine the Premium, Equilibrium, and Discount Zones.
Order Block Integration: An added layer of confluence to identify valid buy and sell signals.
Trend Direction Confirmation: Using a Simple Moving Average (SMA) to determine the overall trend.
Entry and Exit Rules: Based on price position relative to key zones and moving average, along with optional stop-loss and take-profit levels.
Detailed Description
Swing High and Swing Low Analysis
The script calculates Swing High and Swing Low based on the most recent price highs and lows over a specified look-back period (swingHighLength and swingLowLength, set to 8 by default).
It then derives the Premium, Equilibrium, and Discount Zones:
Premium Zone: Represents potential resistance, calculated based on recent swing highs.
Discount Zone: Represents potential support, calculated based on recent swing lows.
Equilibrium: The midpoint between Swing High and Swing Low, dividing the price range into Premium (above equilibrium) and Discount (below equilibrium) areas.
Zone Visualization
The strategy plots the Premium Zone (resistance) in red, the Discount Zone (support) in green, and the Equilibrium level in blue on the chart. This helps visually assess the current price relative to these important areas.
Simple Moving Average (SMA)
A 50-period Simple Moving Average (SMA) is added to help identify the trend direction.
Buy signals are valid only if the price is above the SMA, indicating an uptrend.
Sell signals are valid only if the price is below the SMA, indicating a downtrend.
Entry Rules
The script generates buy or sell signals when certain conditions are met:
A buy signal is triggered when:
Price is below the Equilibrium and within the Discount Zone.
Price is above the SMA.
The buy signal is further confirmed by the presence of an Order Block (recent lowest price area).
A sell signal is triggered when:
Price is above the Equilibrium and within the Premium Zone.
Price is below the SMA.
The sell signal is further confirmed by the presence of an Order Block (recent highest price area).
Order Block
The strategy defines Order Blocks as recent highs and lows within a look-back period (orderBlockLength set to 20 by default).
These blocks represent areas where large players (smart money) have historically been active, increasing the probability of the price reacting in these areas again.
Trade Management and Trade Direction
The user can set Trade Direction to either "Long Only," "Short Only," or "Both." This allows the strategy to adapt based on market conditions or trading preferences.
Based on the Trade Direction, the strategy either:
Closes open trades that are against new signals.
Allows only specific directional trades (either long or short).
Stop-loss levels are defined based on a fixed percentage (stop_loss_percent), which helps to manage risk and minimize losses.
Exit Rules
The strategy uses stop-loss levels for risk management.
A stop-loss price is set at a fixed percentage below the entry price for long positions or above the entry price for short positions.
When the price hits the defined stop-loss level, the trade is closed.
Liquidity Zones
The script identifies recent Swing Highs and Lows as potential liquidity zones. These are levels where price could react strongly, as they represent areas of interest for large traders.
The liquidity zones are plotted as crosses on the chart, marking areas where price may encounter significant buying or selling pressure.
Visual Feedback
The script uses visual markers (green for buy signals and red for sell signals) to indicate potential entries on the chart.
It also plots liquidity zones to help traders identify areas where stop hunts and liquidity grabs might occur.
Monthly Performance Dashboard
The script includes a performance tracking feature that displays monthly profit and loss metrics on the chart.
This dashboard allows the trader to see a visual representation of trading performance over time, providing insights into profitability and consistency.
The table shows profit or loss for each month and year, allowing the user to track the overall success of the strategy.
Key Benefits
Smart Money Concepts (SMC): This strategy incorporates SMC principles like order blocks and liquidity zones, which are used by institutional traders to determine potential market moves.
Zone Analysis: The use of Premium, Discount, and Equilibrium zones provides a solid framework for determining where to enter and exit trades based on price discounts or premiums.
Confluence: Signals are not taken in isolation. They are confirmed by factors like trend direction (SMA) and order blocks, providing greater trade accuracy.
Risk Management: By integrating stop-loss functionality, traders can manage their risks effectively.
Visual Performance Metrics: The monthly and yearly performance dashboard gives valuable feedback on how well the strategy has performed historically.
Practical Use
Buy in Discount Zone: Traders would be looking to buy when the price is discounted relative to its recent range and is above the SMA, indicating an overall uptrend.
Sell in Premium Zone: Conversely, traders would be looking to sell when the price is at a premium relative to its recent range and below the SMA, indicating an overall downtrend.
Order Block Confirmation: Ensures that buying or selling is supported by historical price behavior at significant levels, providing confidence that the market is likely to react at these areas.
This strategy is designed to help traders take advantage of price inefficiencies and areas where institutional traders are likely to be active, increasing the odds of successful trades. By leveraging Smart Money concepts and strong technical confluence, it aims to provide high-probability trade setups.

ADX Breakout Strategy█ OVERVIEW
The ADX Breakout strategy leverages the Average Directional Index (ADX) to identify and execute breakout trades within specified trading sessions. Designed for the NQ and ES 30-minute charts, this strategy aims to capture significant price movements while managing risk through predefined stop losses and trade limits.
This strategy was taken from a strategy that was posted on YouTube. I would link the video, but I believe is is "against house rules".
█ CONCEPTS
The strategy is built upon the following key concepts:
ADX Indicator: Utilizes the ADX to gauge the strength of a trend. Trades are initiated when the ADX value is below a certain threshold, indicating potential for trend development.
Trade Session Management: Limits trading to specific hours to align with optimal market activity periods.
Risk Management: Implements a fixed dollar stop loss and restricts the number of trades per session to control exposure.
█ FEATURES
Customizable Stop Loss: Set your preferred stop loss amount to manage risk effectively.
Trade Session Configuration: Define the trading hours to focus on the most active market periods.
Entry Conditions: Enter long positions when the price breaks above the highest close in the lookback window and the ADX indicates potential trend strength.
Trade Limits: Restrict the number of trades per session to maintain disciplined trading.
Automated Exit: Automatically closes all positions at the end of the trading session to avoid overnight risk.
█ HOW TO USE
Configure Inputs :
Stop Loss ($): Set the maximum loss per trade.
Trade Session: Define the active trading hours.
Highest Lookback Window: Specify the number of bars to consider for the highest close.
Apply the Strategy :
Add the ADX Breakout strategy to your chart on TradingView.
Ensure you are using a 30-minute timeframe for optimal performance.
█ LIMITATIONS
Market Conditions: The strategy is optimized for trending markets and may underperform in sideways or highly volatile conditions.
Timeframe Specific: Designed specifically for 30-minute charts; performance may vary on different timeframes.
Single Asset Focus: Primarily tested on NQ and ES instruments; effectiveness on other symbols is not guaranteed.
█ DISCLAIMER
This ADX Breakout strategy is provided for educational and informational purposes only. It is not financial advice and should not be construed as such. Trading involves significant risk, and you may incur substantial losses. Always perform your own analysis and consider your financial situation before using this or any other trading strategy. The source material for this strategy is publicly available in the comments at the beginning of the code script. This strategy has been published openly for anyone to review and verify its methodology and performance.

Global Index Spread RSI StrategyThis strategy leverages the relative strength index (RSI) to monitor the price spread between a global benchmark index (such as AMEX) and the currently opened asset in the chart window. By calculating the spread between these two, the strategy uses RSI to identify oversold and overbought conditions to trigger buy and sell signals.
Key Components:
Global Benchmark Index: The strategy compares the current asset with a predefined global index (e.g., AMEX) to measure relative performance. The choice of a global benchmark allows the trader to analyze the current asset's movement in the context of broader market trends.
Spread Calculation:
The spread is calculated as the percentage difference between the current asset's closing price and the global benchmark index's closing price:
Spread=Current Asset Close−Global Index CloseGlobal Index Close×100
Spread=Global Index CloseCurrent Asset Close−Global Index Close×100
This metric provides a measure of how the current asset is performing relative to the global index. A positive spread indicates the asset is outperforming the benchmark, while a negative spread signals underperformance.
RSI of the Spread: The RSI is then calculated on the spread values. The RSI is a momentum oscillator that ranges from 0 to 100 and is commonly used to identify overbought or oversold conditions in asset prices. An RSI below 30 is considered oversold, indicating a potential buying opportunity, while an RSI above 70 is overbought, suggesting that the asset may be due for a pullback.
Strategy Logic:
Entry Condition: The strategy enters a long position when the RSI of the spread falls below the oversold threshold (default 30). This suggests that the asset may have been oversold relative to the global benchmark and might be due for a reversal.
Exit Condition: The strategy exits the long position when the RSI of the spread rises above the overbought threshold (default 70), indicating that the asset may have become overbought and a price correction is likely.
Visual Reference:
The RSI of the spread is plotted on the chart for visual reference, making it easier for traders to monitor the relative strength of the asset in relation to the global benchmark.
Overbought and oversold levels are also drawn as horizontal reference lines (70 and 30), along with a neutral level at 50 to show market equilibrium.
Theoretical Basis:
The strategy is built on the mean reversion principle, which suggests that asset prices tend to revert to a long-term average over time. When prices move too far from this mean—either being overbought or oversold—they are likely to correct back toward equilibrium. By using RSI to identify these extremes, the strategy aims to profit from price reversals.
Mean Reversion: According to financial theory, asset prices oscillate around a long-term average, and any extreme deviation (overbought or oversold conditions) presents opportunities for price corrections (Poterba & Summers, 1988).
Momentum Indicators (RSI): The RSI is widely used in technical analysis to measure the momentum of an asset. Its application to the spread between the asset and a global benchmark allows for a more nuanced view of relative performance and potential turning points in the asset's price trajectory.
Practical Application:
This strategy works best in markets where relative strength is a key factor in decision-making, such as in equity indices, commodities, or forex markets. By assessing the performance of the asset relative to a global benchmark and utilizing RSI to identify extremes in price movements, the strategy helps traders to make more informed decisions based on potential mean reversion points.
While the "Global Index Spread RSI Strategy" offers a method for identifying potential price reversals based on relative strength and oversold/overbought conditions, it is important to recognize that no strategy is foolproof. The strategy assumes that the historical relationship between the asset and the global benchmark will hold in the future, but financial markets are subject to a wide array of unpredictable factors that can lead to sudden changes in price behavior.
Risk of False Signals:
The strategy relies heavily on the RSI to trigger buy and sell signals. However, like any momentum-based indicator, RSI can generate false signals, particularly in highly volatile or trending markets. In such conditions, the strategy may enter positions too early or exit too late, leading to potential losses.
Market Context:
The strategy may not account for macroeconomic events, news, or other market forces that could cause sudden shifts in asset prices. External factors, such as geopolitical developments, monetary policy changes, or financial crises, can cause a divergence between the asset and the global benchmark, leading to incorrect conclusions from the strategy.
Overfitting Risk:
As with any strategy that uses historical data to make decisions, there is a risk of overfitting the model to past performance. This could result in a strategy that works well on historical data but performs poorly in live trading conditions due to changes in market dynamics.
Execution Risks:
The strategy does not account for slippage, transaction costs, or liquidity issues, which can impact the execution of trades in real-market conditions. In fast-moving markets, prices may move significantly between order placement and execution, leading to worse-than-expected entry or exit prices.
No Guarantee of Profit:
Past performance is not necessarily indicative of future results. The strategy should be used with caution, and risk management techniques (such as stop losses and position sizing) should always be implemented to protect against significant losses.
Traders should thoroughly test and adapt the strategy in a simulated environment before applying it to live trades, and consider seeking professional advice to ensure that their trading activities align with their risk tolerance and financial goals.
References:
Poterba, J. M., & Summers, L. H. (1988). Mean Reversion in Stock Prices: Evidence and Implications. Journal of Financial Economics, 22(1), 27-59.

Adaptive Squeeze Momentum StrategyThe Adaptive Squeeze Momentum Strategy is a versatile trading algorithm designed to capitalize on periods of low volatility that often precede significant price movements. By integrating multiple technical indicators and customizable settings, this strategy aims to identify optimal entry and exit points for both long and short positions.
Key Features:
Long/Short Trade Control:
Toggle Options: Easily enable or disable long and short trades according to your trading preferences or market conditions.
Flexible Application: Adapt the strategy for bullish, bearish, or neutral market outlooks.
Squeeze Detection Mechanism:
Bollinger Bands and Keltner Channels: Utilizes the convergence of Bollinger Bands inside Keltner Channels to detect "squeeze" conditions, indicating a potential breakout.
Dynamic Squeeze Length: Calculates the average squeeze duration to adapt to changing market volatility.
Momentum Analysis:
Linear Regression: Applies linear regression to price changes over a specified momentum length to gauge the strength and direction of momentum.
Dynamic Thresholds: Sets momentum thresholds based on standard deviations, allowing for adaptive sensitivity to market movements.
Momentum Multiplier: Adjustable setting to fine-tune the aggressiveness of momentum detection.
Trend Filtering:
Exponential Moving Average (EMA): Implements a trend filter using an EMA to align trades with the prevailing market direction.
Customizable Length: Adjust the EMA length to suit different trading timeframes and assets.
Relative Strength Index (RSI) Filtering:
Overbought/Oversold Signals: Incorporates RSI to avoid entering trades during overextended market conditions.
Adjustable Levels: Set your own RSI oversold and overbought thresholds for personalized signal generation.
Advanced Risk Management:
ATR-Based Stop Loss and Take Profit:
Adaptive Levels: Uses the Average True Range (ATR) to set stop loss and take profit points that adjust to market volatility.
Custom Multipliers: Modify ATR multipliers for both stop loss and take profit to control risk and reward ratios.
Minimum Volatility Filter: Ensures trades are only taken when market volatility exceeds a user-defined minimum, avoiding periods of low activity.
Time-Based Exit:
Holding Period Multiplier: Defines a maximum holding period based on the momentum length to reduce exposure to adverse movements.
Automatic Position Closure: Closes positions after the specified holding period is reached.
Session Filtering:
Trading Session Control: Limits trading to predefined market hours, helping to avoid illiquid periods.
Custom Session Times: Set your preferred trading session to match market openings, closings, or specific timeframes.
Visualization Tools:
Indicator Plots: Displays Bollinger Bands, Keltner Channels, and trend EMA on the chart for visual analysis.
Squeeze Signals: Marks squeeze conditions on the chart, providing clear visual cues for potential trade setups.
Customization Options:
Indicator Parameters: Fine-tune lengths and multipliers for Bollinger Bands, Keltner Channels, momentum calculation, and ATR.
Entry Filters: Choose to use trend and RSI filters to refine trade entries based on your strategy.
Risk Management Settings: Adjust stop loss, take profit, and holding periods to match your risk tolerance.
Trade Direction Control: Enable or disable long and short trades independently to align with your market strategy or compliance requirements.
Time Settings: Modify the trading session times and enable or disable the time filter as needed.
Use Cases:
Trend Traders: Benefit from aligning entries with the broader market trend while capturing breakout movements.
Swing Traders: Exploit periods of low volatility leading to significant price swings.
Risk-Averse Traders: Utilize advanced risk management features to protect capital and manage exposure.
Disclaimer:
This strategy is a tool to assist in trading decisions and should be used in conjunction with other analyses and risk management practices. Past performance is not indicative of future results. Always test the strategy thoroughly and adjust settings to suit your specific trading style and market conditions.

SMB MagicSMB Magic
Overview: SMB Magic is a powerful technical strategy designed to capture breakout opportunities based on price movements, volume spikes, and trend-following logic. This strategy works exclusively on the XAU/USD symbol and is optimized for the 15-minute time frame. By incorporating multiple factors, this strategy identifies high-probability trades with a focus on risk management.
Key Features:
Breakout Confirmation:
This strategy looks for price breakouts above the previous high or below the previous low, with a significant volume increase. A breakout is considered valid when it is supported by strong volume, confirming the strength of the price move.
Price Movement Filter:
The strategy ensures that only significant price movements are considered for trades, helping to avoid low-volatility noise. This filter targets larger price swings to maximize potential profits.
Exponential Moving Average (EMA):
A long-term trend filter is applied to ensure that buy trades occur only when the price is above the moving average, and sell trades only when the price is below it.
Fibonacci Levels:
Custom Fibonacci retracement levels are drawn based on recent price action. These levels act as dynamic support and resistance zones and help determine the exit points for trades.
Take Profit/Stop Loss:
The strategy incorporates predefined take profit and stop loss levels, designed to manage risk effectively. These levels are automatically applied to trades and are adjusted based on the market's volatility.
Volume Confirmation:
A volume multiplier confirms the strength of the breakout. A trade is only considered when the volume exceeds a certain threshold, ensuring that the breakout is supported by sufficient market participation.
How It Works:
Entry Signals:
Buy Signal: A breakout above the previous high, accompanied by significant volume and price movement, occurs when the price is above the trend-following filter (e.g., EMA).
Sell Signal: A breakout below the previous low, accompanied by significant volume and price movement, occurs when the price is below the trend-following filter.
Exit Strategy:
Each position (long or short) has predefined take-profit and stop-loss levels, which are designed to protect capital and lock in profits at key points in the market.
Fibonacci Levels:
Fibonacci levels are drawn to identify potential areas of support or resistance, which can be used to guide exits and stop-loss placements.
Important Notes:
Timeframe Restriction: This strategy is designed specifically for the 15-minute time frame.
Symbol Restriction: The strategy works exclusively on the XAU/USD (Gold) symbol and is not recommended for use with other instruments.
Best Performance in Trending Markets: It works best in trending conditions where breakouts occur frequently.
Disclaimer:
Risk Warning: Trading involves risk, and past performance is not indicative of future results. Always conduct your own research and make informed decisions before trading.
